Inflation as measured by the Consumer Price Index hit 5.4% year-over-year in September, which is over double what the Federal Reserve said is its goal (2%). There are increasing numbers of Fed critics joining your friendly neighborhood Bereans, most humorously by former Treasury Secretary Larry Summers:
SYDNEY–Former U.S. Treasury Secretary Larry Summers has sounded alarm bells over risks of runaway inflation in the U.S., saying the Federal Reserve is moving glacially in its efforts to counter the threat. The Fed’s traditional role is to “remove the punchbowl just before the party starts,” Mr. Summers told a Citi investment conference in via Zoom on Wednesday.“ Now the party’s gotten great and the Fed’s not removing the punchbowl until they’ve seen…conclusive evidence that everyone’s going to get plastered,” he said.
Mr. Summers said record labor shortages, 20% housing inflation, the highest oil and gasoline prices in eight years and the government involved in a major fiscal stimulus program have all been warning signs of a costly rise in inflation and inflation expectations. Amid all of this the Fed is continuing a major monetary expansion by buying bonds, he said. “I don’t think we are in a terribly rational or sound place. I think we are taking big risks,” Mr. Summers said.
I’ve blogged extensively over the years that Federal Reserve policy is leading to a huge misallocation of capital (investing in the wrong kinds of things) and argued this won’t end well. My curse is I’m a student of monetary history, and as Mark Twain said, history doesn’t repeat itself, but it does rhyme. Further, I’ve argued that the easy money policy of the global central banks (led by the Fed) have disconnected asset prices generally from any rational valuation basis, which leads to both poor additional economic decisions as well as a more fragile market structure–one that depends on continued massive doses of central bank liquidity to sustain the capital misallocation. But for the remainder of this post and at least the next, I’d like to provide an inflation 101 post. We all see the effects of the rising prices, and various explanations of why. This may be helpful in planning your own response to these inflationary pressures.
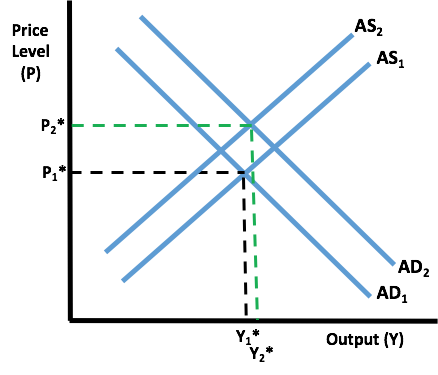
To begin with, I’m going to use the common (but unhelpful) understanding of consumer prices. While I think this failed focus is what allows the insanity (i.e., if consumer prices aren’t galloping out of control that monetary policy is just fine), I’d like to initially provide a very conventional view. You’ve heard in economics it’s all just about supply and demand, and that is roughly true–at least the economic issue can almost always be explained in those terms with a simple but not simplistic model. But when we think about about general consumer prices we’ll want to focus on total (aggregate) demand, and total (aggregate) supply because we are not particularly interested in what is happening in one particular market or good–in a market economy there are always price adjustments that occur seemingly non-stop. When demand and supply are in equilibrium, you will have a stable price and output level, found at P* and Y* in the diagram below:

The demand side of the economy is really all about spending–buying the stuff that has been produced. Economists group these spending categories four ways, with Consumption (C), Investment (I), Government (G) and Net Exports (NX):
Y = C + I + NX + G
The supply side of the economy is all about production; nothing can be consumed that is not first produced. The total output level Y (which by definition is the same output that is consumed by spending) is a function of how many productive inputs can be used (labor (L), physical capital (K), human capital (H), natural resources (N), and how well we use them (technology, best productive technique, level of entrepreneurial creative activity, etc, which we’ll capture with the term A).
Y = A * f(L, K, H, N)
So when the economy is slower than expected, one can think about increasing spending, to “stimulate” more productive activity, or one can think about how we might change the incentives to work, save and invest, to create more supply. Not surprisingly, politicians interested in short-term political support like to stimulate the economy through government spending G. In their thinking, there is no opportunity cost (i.e., no necessary reduction in C or I because of an increase in G), and since the deficit doesn’t matter since “we owe it all to ourselves,” it is responsible politics to spend whatever is necessary to get the economy to full employment. Now there is some realization that spending by government could be too high, leading to inflation, but the prescription for that is simply raising taxes to cool the private sector’s demand for consumption or investment. Alternatively, one could focus on the supply side, to focus on how we could get more labor and capital into the economy, and perhaps cutting taxes could be part of the stimulus. Either way, this is the typical macroeconomic view of managing the economy.
So when we begin looking for explanations as to an increasing price level, there are really two possibilities, or a combination thereof. We can have supply reduced, which shifts the AS curve to the left, or we can have an increase in AD, which shifts that curve to the right. In the Diagram below I’ve shown both–both effects (while conceptually distinct), lead to the same result–a higher price level. Note that what happens to output is indeterminate–we could have higher prices with reduced output (stagflation) or higher prices with higher output (the normal inflationary result). In the diagram below, I’ve shown a slight increase in output to go with the increase in price level, as this is what we’ve seen happen (our real GDP numbers are currently slightly higher than prior to the shutdown of the economy.
Washington politicians (with rare exceptions) tend to think of all macroeconomic policymaking in terms of managing aggregate demand. As the saying goes, when the only tool you have is a hammer, everything looks like a nail. Yet the initial crisis was clearly manifested on the supply side of the economy–the government ordered what it deemed “non-essential” shut down. As a reminder, this was to be for two weeks to break the curve and not allow our hospitals to be overwhelmed. With the initial halt to productive activity, the government initiated several programs to ensure spending continued. At some level you can understand this–with no work happening and no paychecks coming in, and with the realization that a large portion of our population does not have any savings*, people still need to eat. But you can’t eat what you didn’t produce–and our global economy only has a matter of weeks of total consumption available without additional production. Food prices started rising quickly, and really haven’t looked back, even though other parts of the consumption basket fell (e.g., fuel prices, leisure/travel). We’ll look at some of these specifics in the 3rd post, but didn’t someone say that “inflation is always and everywhere a monetary phenomenon”? Yes, Milton Friedman did, and this dictum is always and everywhere true. So in the next post, we’ll look at what has been happening in money.
* Clearly the pandemic worsened savings levels, but the level was already high.
 Bert Wheeler
 Jeff Haymond
 Marc Clauson
 Mark Caleb Smith
 Tom Mach