Since 1964, Ohio had always voted for the winning presidential candidate. In 2020, that streak stopped, with Donald Trump winning the Buckeye State 53.3% to 45.2%.* This could be a one time thing, but I doubt it. Just as Republicans have dominated the state’s politics in recent history, so are they beginning to control presidential elections as well. Ohio, it seems, is no longer a battleground state.
So, what happened and why did it happen? Those questions demand book-length answers, but let’s turn over a few rocks for a blog post.** In 2000, George W. Bush won Ohio by a few percentage points (49.9-46.5). If you look at county-level results, southeastern Ohio either marginally broke for Bush or went Gore. Besides Athens (which typically goes Democratic), Monroe and Belmont went to Gore. Tracing up to northeastern Ohio, Democrats did well in the entire region. Ashtabula, Trumbull, Mahoning, Portage, Summit, Lorain, and Erie joined Democratic stronghold Cuyahoga (Cleveland) in Gore’s column. Republicans controlled most of the rest of the state except for Franklin, Lucas, Clark, and Montgomery counties. Western Ohio was strongly red. Throughout the state, only two counties (Putnam and Holmes) went 70%+ for Republicans.
By 2020, Ohio looks radically different. President Trump won handily (53.3 to 45.2), more than double Bush’s victory in 2000. Democrats won only seven counties (Hamilton, Montgomery, Lucas, Franklin, Athens, Cuyahoga, and Summit). Every region of the state was Republican, but that does not portray the dominance. In the most shocking statistic, a quick look at the final results shows that 44 of Ohio’s 88 counties voted for Trump with 70% or more of the total presidential vote. Eight of the 88 counties went 80%+ for President Trump.
Monroe County provides an interesting profile of the transformation. Nestled in the Appalachian region, it borders West Virginia. Demographically, Monroe is 97% white, with less than ten percent of the residents holding a college degree. The median household income is around $43,000, more than $10,000 below Ohio’s average. Monroe gave George W. Bush 44% of its presidential vote in 2000. In 2020, Donald Trump won 76% of the county’s voters.
This isn’t to argue that Trump only did well in “whiter” or less educated counties alone. President Trump won almost 65% of the vote in Warren County, where nearly 40% of the population has a college degree. Of course, in 2000, Bush won Warren County with 69.9% of the vote. What made Monroe County more supportive of Trump than Warren County? Why did counties full of working-class whites with high school degrees transition toward the G.O.P.? Perhaps most critically, will this last, or is Trump’s appeal unique?
Ohio did not settle the 2020 election, but the Midwest (along with Georgia, Arizona, and Nevada) largely did, just as in 2016. Michigan, Wisconsin, and Pennsylvania reverted back to Democrats, while Ohio, clearly, did not. The 2016 and 2020 margins in those state were razor thin, but in Ohio, Trump was dominant in both cycles. An obvious question: how is Ohio different from these other Midwestern states that now feel more like bellwethers than the Buckeye State?
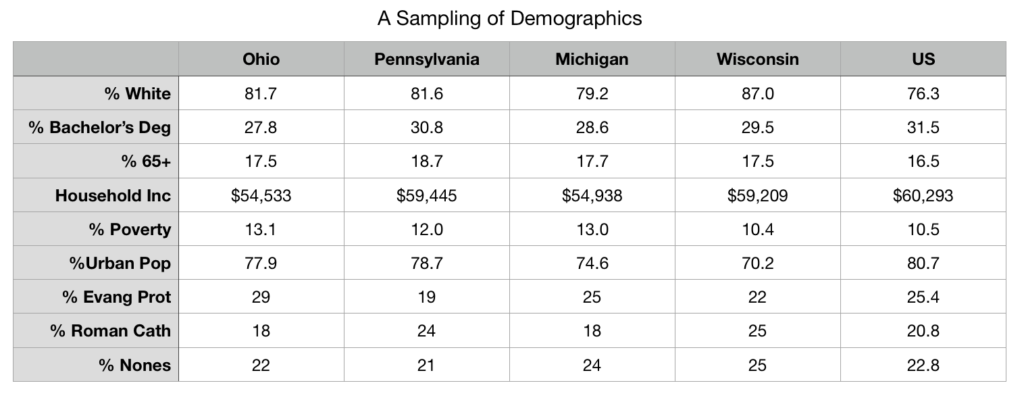
Looking at basic demographics does not really answer the question. While there are differences between the states, they are mostly minor, or when they are not, the differences don’t hold up across the group. Ohio has the lowest household income of the four, but it is only slightly smaller than Michigan’s. Ohio is actually more urban than either Michigan or Wisconsin, and Pennsylvania has the largest cohort of 65 or older voters.
One interesting wrinkle concerns religion. When you think of the poles of current American religion, we usually consider evangelicals and “nones” as the extreme positions. Of the four Midwestern states, Ohio has the largest evangelical population (29%) and a smaller group of “nones” (22) than Michigan and Wisconsin. This gives Ohio a larger differential, with +7 evangelical spread when compared to Pennsylvania (-2), Michigan (+1), and Wisconsin (-3). Playing this down into the county level would maybe reveal more interesting results.***
Also, I need to delve into the economic realities of these states, and probably the entire region. This will have to come in later. Examining unemployment, per capita g.d.p., growing and contracting economic sectors, and many other things, may shed additional light on the degree to which this is an economic reaction. Maybe the support for Trump, in particular, is motivated by the perception of limited opportunities and the hope he might remedy the situation. This seems to be the conventional wisdom, though I am still unclear how much of that is supported by data. Of course, that kind of insight could only come through individual data (surveys and interviews) and could not be inferred through statewide or county-level analyses. Regardless, I have a lot of work (in the literature and data) to do to make anything resembling hard statements. I’m just looking over things at this point.
Any discussion of Ohio’s role in presidential politics would have to come in light of state politics as well. The G.O.P. has been dominant at the state level, with the party winning seven of the last eight gubernatorial elections, and enjoying strong majorities in the General Assembly. While this is mostly anecdotal, it feels like there is a developing wedge within the state’s Republican Party, as some within it take on a more nationalist and populist tone, much like President Trump’s, and others maintain Ohio’s reputation for moderation. Which of these groups will control the party moving forward? 2022 looms as an important indicator for the future of Ohio and, perhaps, the rest of the nation.
*As I write this on December 11, 2020, most Republican members of Congress are still unwilling to say the above publicly. The U.S. Supreme Court has already refused to address a lawsuit stemming from Pennsylvania, while a motion to file was denied by the Supreme Court due to Texas’ lack of standing. We will see if more happens.
**Arguably, J.D. Vance’s Hillbilly Elegy and Charles Murray’s Coming Apart address these matters in cultural and empirical ways, but they don’t attack the question directly.
***The demographic data come from the U.S. Census. The religious estimates are from Pew, though they are arguable in many ways.
 Bert Wheeler
 Jeff Haymond
 Marc Clauson
 Mark Caleb Smith
 Tom Mach