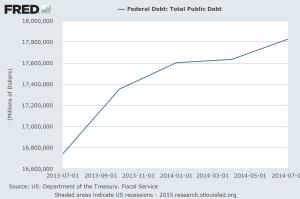
As the new Republican congress gets set to tackle the Obama agenda, its pertinent to ask if we’re winning or losing on spending. After all, this is supposedly the reason for the rise of the tea party–out of control spending on the part of the Obama administration. This past fall the U.S. government reported the federal deficit fell to $483B, its lowest level in 6 years, and as a % of GDP, lower than the 40 year average. That’s good right? Well, its certainly headed in the right direction. But things get curiouser if you poke a bit further. How much did the national debt rise last year? Well, one would suppose that since the national debt is simply the cumulative sum of all previous deficits and surpluses, that the national debt would have risen by ~$483B. But you would be very wrong to assume that. According to the U.S. Treasury, we added over $1T more debt last year. So what’s the deal? The Fed’s data lags slightly, but also seems to say we added about $1T last year in debt (but at least they make it available in handy chart form):
I haven’t had the time to fully research this discrepancy, but I suspect it has a lot to do with us spending social security contributions on current expenditures–contributions that are supposed to be saved for the corresponding future obligation. This is why the national debt kept rising during Mr.Clinton’s so-called “surplus” years–we were simply counting as revenues monies that were supposed to be saved for social security recipients, and we spent it like drunken sailors. The same way we are spending it now. So yes, Virginia, there is a Santa Claus, but you owe another $1T just the same. So this doesn’t paint a very positive picture. But here is another chart that puts things a little differently, and much more positively:
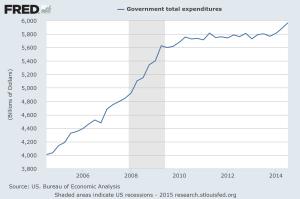
Whoa! the drunken sailors keep drinking, but they’ve been put on a strict day limit to the liquor! This is total government spending (fed/state/local), but it’s eye-opening: the government share of the economy has stopped growing! How ’bout just the Fed spending?
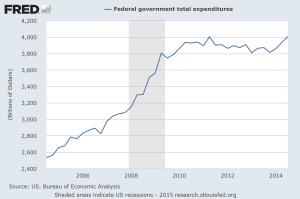
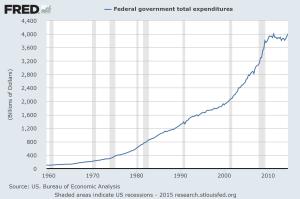
Not surprising when the Federal government has the largest slice of government spending, it drives the result and so the results look the same. This is encouraging: in an Obama era of progressive hubris, federal spending has basically went sideways after the two year climatic binge in ’08-09. For those critics of congressional Republicans (and especially for those critics of Mitch McConnell, who orchestrated the Sequester), consider what has happened with only control of the House of Representatives against the backdrop of the same chart over the last 40 years:
As I teach in my macro class, the debt is not too difficult a problem to pay off: I would even be prepared to tell the drunken sailors, I’ll let you keep drinking even more than you did the previous year (i.e., run further deficits), but only on the condition that you allow the economy to grow faster than your drunken binge is growing. Over time, as a % of GDP, our debt would fall–basically how we did it after WWII. But in the last few years, we’ve done better than that. We’ve basically put a halt to new additional spending. To be sure, this is no time to declare victory, as the uptick at the end of the data warns us. But the Obama era has already crippled the Democratic party, and even his victories are likely going to be seen as pyrrhic. Now if we can just get a handle on excessive regulation…..
So over to you. Are we winning or are we losing?


 Bert Wheeler
 Jeff Haymond
 Marc Clauson
 Mark Caleb Smith
 Tom Mach