Mid-term elections are typically rough for the President’s party. Below are some figures that simply lay out results in mid-terms between 1946 and 2014. The first figure looks at results in the U.S. House.
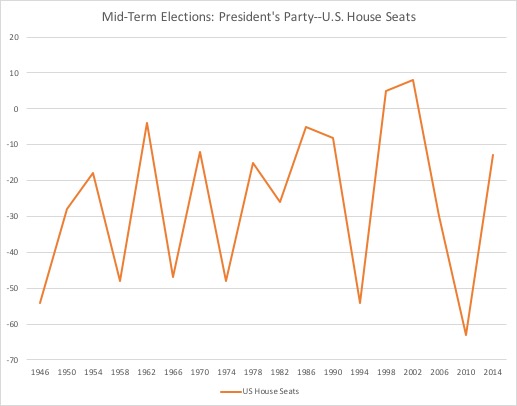
Some things jump out quickly. There is a significant amount of variability, but nearly all of it is in negative territory. The question is how badly will the party in the White House do as opposed to how well might it do. Only twice since 1946 have we seen positive numbers. In 1998, Bill Clinton and the Democrats capitalized on a strong economy and Clinton’s relative popularity. Also, the massive Republican surge in 1994, which allowed the GOP to gain control of both houses of Congress, had a slight amount of retrenchment in 1998. In 2002, the Bush presidency was still responding to the terror attacks of 9/11. Bush himself was still popular, so the public opinion tumble that happened later had not yet started. Beyond those two outliers, the results are sobering for the White House. The President’s party loses 25.5 House seats on average during mid-term elections.
Results in the U.S. Senate are similar.
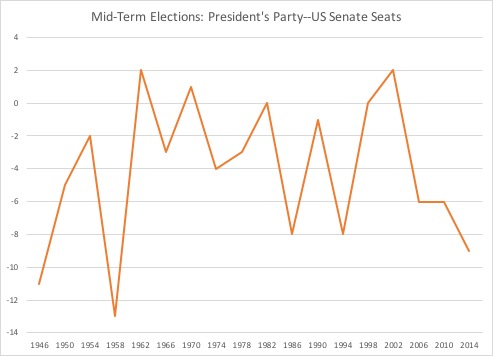
A third of Senators are running in any given mid-term, so there are 33 or 34 elections typically happening in a cycle. There is similar variability, but, again, it is mostly on the negative side of the figure. The question, again, is one of relative decline. As with the House, there are some exceptions, and the numbers are small enough that ruling parties can tread water or suffer comparatively little in the Senate. On the other hand, we have seen shifts of 11, 13, 8, 8, and 9 seats away from the President’s party. On average, the occupant of the White House can expect to lose around 4.1 Senate seats in a typical mid-term cycle.
Some elections are swing or “wave” events where the minority party either radically eats into the majority’s margins in Congress or seize control of one or both chambers. In 1946 and 2010, the House swung from the Democrats to the Republicans. In 1986 and 2014, the Senate alone changed hands (from R to D in 1986 and D to R in 2014). In 1954 and 1994, control of both chambers of Congress went from the President’s party to his opposition. In 1954, the mid-terms were correctives to a degree. Eisenhower, the national hero, helped the GOP to a congressional majority for the first time in decades in 1952, but the gains were short-lived. The election was an anomaly at the congressional level, with Congress shifting mostly back toward the Democrats for the next four decades. However, Eisenhower’s presidential performance did portend growing Republican strength, especially in the South.
1994 marked the first time, since 1952, the Republicans took control of both chambers. Bill Clinton’s presidency was off to a rocky start. The administration had mis-fired on health care and Republicans were able to paint the Clintons as radicals. At the same time, the GOP was growing in suburban pockets of the United States, and its impact in the South was being felt below the presidential level. There were significant systematic shifts taking place, as well as some short-term political winds that helped Republicans.
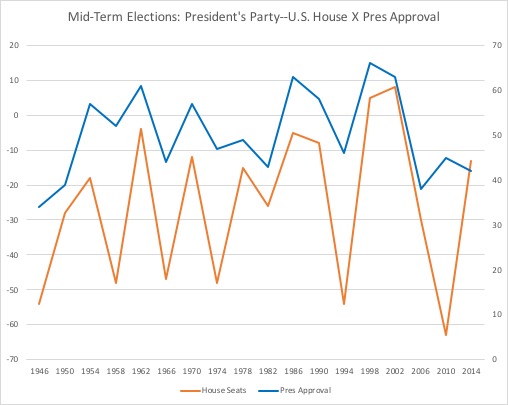
As referenced above, the president’s popularity may, in some ways, blunt these trends by acting as a buffer against mid-term fallout. Popular presidents can see minimal losses. Let’s look at the same figures above, but this time with presidential popularity added. See the right side for the secondary Y axis, here with approval being measured by Gallup approval numbers the week of or week before the mid-term election.
Here is the same figure with Senate seats.
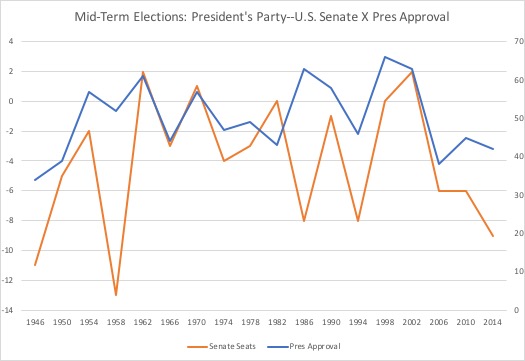
If we think of 50% presidential approval as a cut-off point, we see a better pattern for presidents. “Popular” presidents, those above 50% approval, see average House losses of 10.25 seats and Senate setbacks of 2.4 seats. Those below that threshold suffer losses of 37.8 and 5.5 House and Senate seats respectively.
2018
Republicans have narrow majorities in the House and Senate. Democrats must pick up 23 seats in the House and 2 seats in the US Senate to swing control of either chamber. Those numbers seem well within striking distance given the past averages. President Trump has been uneven in performance. The White House has scored some undeniable successes with tax reform, judicial appointments, and regulatory reduction. The White House has also suffered some setbacks, like the inability to repeal the Affordable Care Act, constant staff turnover, and a long investigation into the presidential election, which has ensnared a variety of officials connected to the Trump campaign and administration. Trump has also been uniquely divisive through rhetoric. Gallup has never tracked Trump’s approval rating as above 50%, though it has moved up lately. During the past three weeks, Trump has gone from 41% to 44%.
If we just take the numbers on their face, we can predict what might happen in November. Given past results at the aggregate level, and using the president’s 44% approval rating as it stands now, I’d predict* the Republicans to lose 35 House seats and 5 Senate slots. Obviously, those results would be enough to tilt Congress against Republicans and the White House. It would be, institutionally, the beginning of a new day.
There are reasons to think these estimates might be a high. First, the GOP has gerrymandered itself into House seats that are arguably more secure than congressional majorities from the 1950s through the 1990s. Technology, and more and better data, has granted them safer seats than their predecessors. While large swings can happen, it is most likely they will happen against Democrats in the near term. In 2010, the Republicans gained an astonishing 63 House seats in the mid-term election. A similar Democratic victory seems unlikely unless we are witnessing the beginnings of the destruction of the GOP. Republicans control the state legislatures and governor’s mansions in 25 states, and control the legislatures in another six states. So in more than 60% of the states, the GOP has effective control of redistricting. This suggests GOP losses now may buck historic trends. Numbers in the low to mid 20s seem like a given. I’d expect the Democrats to either regain the House or to render the majority almost powerless due to a one or two seat majority.
Second, the U.S. Senate contests are not normal. Republicans are defending fewer seats than the Democrats, and some of the Democratic seats are in “red” states where Donald Trump is either extremely popular now or did well there in 2016 cycle. In North Dakota, Heitkamp’s seat is trending Republican. In Montana, Indiana, Missouri, and Florida we are seeing tight races for incumbent Democrats in other red states. I’d expect the GOP to take at least three of those five seats, which would give the Republicans three pickups. Democrats are targeting Tennessee, Arizona, and Nevada. The Democrats would need to take at least two if not all three of those seats to come close to gain the majority. Given the realities in these states, and current polling, I’d expect the GOP to lose at most one seat, and it is very possible the party will break even or gain a seat. I think the odds are the Senate stays Republican for now.
Once all of this shakes out, we will have to consider how Donald Trump might react.
*This was using simple linear regression with presidential approval as measured by Gallup as X and House results and Senate results as Y. Yes, I know, simple. With 44% as the stand-in for X, predicted Y was 35.6 and 5.6, but I rounded down instead of choosing to portray elected officials as anything other than a “whole person.” Granted, one might question the existence of their souls on occasion, but I did not allow such metaphysical judgments to bias my “analysis.”
 Bert Wheeler
 Jeff Haymond
 Marc Clauson
 Mark Caleb Smith
 Tom Mach